Story of Hyperbolicity: a journey from geometry to solvability of word problems in non-technical terms

The word 'hyperbolic' is fascinating. What does it even mean? Like many other words in mathematical science, its meaning has evolved over time. In this article, in layman's language, we will take a tour of hyperbolicity through geometry, algebra and their wonderful reunion. No more than middle school mathematics is needed to carefully follow this story.

What is a hyperbolic space?

In the context of geometry, 'hyperbolicity' had a very specific meaning.

Consider a straight line L and a point P outside the straight line. How many lines can you draw through P that will never meet L (that is parallel to L)? If you are drawing this on a piece of paper then the answer is 1.

1 Parallel (photo from internet)

However it is possible to think about spaces where the answer is 0 (can you think of one such space? You know it for sure!)

Yet another leap of reasoning will take you to another type of space where the answer is infinity. That is, given a line L and point P outside the line L, we can draw infinitely many lines through P parallel to L.

A model of a space where infinitely many lines (arcs in the picture) does not meet a given line. (Photo from internet)

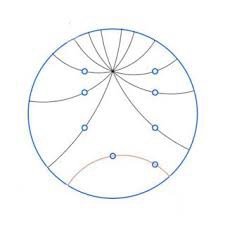
This type of space, however hard it is to imagine, theoretically exists. Such spaces are called hyperbolic spaces and this property (of having infinitely many parallel lines) is called hyperbolicity.

The way I think about it is, the space itself 'bends away' too quickly thus making a tonne of lines on it to bend away from the given line L. This sort of 'imagination' has its problems. In fact, a theorem of Hilbert roughly says, that such a space cannot be 'imagined' using our intuition of three dimensional space.

This meaning of hyperbolicity was conceived in 1830s by Gauss and later by Bolyai and Lobachevsky. But that was just the starting point of the journey of the word 'hyperbolicity'.

What are groups and how Dehn studied them?

About 70 years later, Dehn used the (evolved) strategy of hyperbolicity in a completely new context: to solve word problems in certain groups. Actually Gromov 'uncovered' this strategy embedded in Dehn's methods about another 70 years later. Notice that I mentioned 'hyperbolicity' as a strategy for solving problems instead of a concept. The meaning of this will be clear shortly.

A group is basically a set where you can combine (add) elements to create a new element of the same set. You could also substract one element from another. Though I am saying 'add', this operation can be some other rule of combination.

For example, the set of integers can be regarded as a group. In this 'set' one can 'add' two integers to get another integer.

In any group, we can specify an important subset S called 'generators' of the group. The generators, 'generate' the group, in the sense, you may repeatedly combine the generators to create all the elements of the set. For example, in the group of integers, {1, -1} is a set of generators.

Groups are important for a variety of reasons. They are among the most elementary algebraic structures that one can study (elementary does not mean 'simple'; group theorists know that even simple groups may not be 'simple''!

Another reason might be this: groups are used to model symmetries of objects. Since symmetries are important in physics and in many other sciences, therefore groups are important.

At any rate, given a group (a set) G, we can create 'words'. Here we are thinking about elements of the set G as 'letters'. One can combine (or add) several letters to form a new element of the same group. This combination of several letters is referred to as a 'word' which is also an element of G.

Word problem for a group

How do we tell if two words (created by combining letters) represent the same element of the group or not? This is known as the word problem of a group. It is, in general, very hard to figure this out.

Here is an example. Consider the set of symmetries of an equilateral triangle: three reflections (about each median) and three rotations (0, 120, 240 degrees) about the centroid. Lets write the elements as {R1, R2, R3, Rot1, Rot2, Rot3}. They form a group. You can check this. For example combining any two elements this set, you will get another element of the same set.

Symmetries of Equilateral triangle (photo from internet)

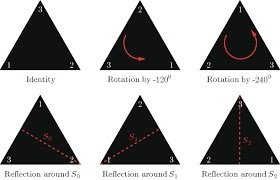
You can actually combine two symmetries. Lets use * instead of 'add' for this sort of rule of combination of group elements.

For example R1*Rot2 means: first do a rotation by 120 degrees about centroid and the do a reflection about the first median. In this way, you can combine several elements to create a 'word'. But that word is again an element of the group (as combining elements of a group, by definition, gives another element of a group). In fact the same element can be written in many ways (in many words).

Now lets write down two weird looking words:

Word1 = R1*Rot1*R2*R1*Rot1*R2*R1*Rot1*R2

Word1 = R3*Rot1*R2*R1*Rot1*R3

Do Word1 and Word2, represent the same element of the group? As I mentioned before, this is hard to check in general. However for certain types of groups, there are short algorithms to check this.

Group of Loops

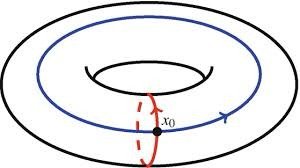
There is an important class of groups that was studied by Dehn. This class, for the sake of simplicity, is known as group of loops. Here is how you can think about it.

Given a space X, fix a point P in X and draw all loops starting and ending at P. This set (after doing some stuff) can be regarded as group. For example you can combine two loops by simply travelling along the first one first and then the second one.

Two loops on a torus (photo from internet)

For certain types of spaces, these Group of Loops has a beautiful property called D- hyperbolicity. These groups have a solvable word problem. That is, given two words using letters of the group, you can check if they represent the same element of the group using an algorithm (that does the job in a 'small' amount of time.)

What is D-hyperbolicity?

To understand the notion of D-hyperbolicity one should think of a group (a set of elements whose members can be combined to produce other members of the same set) as dots and segments. Represent each element of the group by a dot (make sure to label it the name of the group member). Join two dots g1 and g2 if g2 - g1 is a generator of the group G.

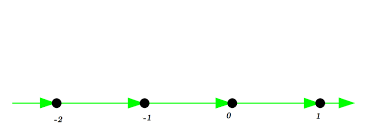
This creates a 'Cayley graph' of the group G. It contains bunch of dots and line segments known as edges. For example the Cayley graph of the group of integers with respect to the generating set {1, -1} looks like a straight line.

Cayley Graph of integers (Photo from internet)

You can draw triangles on the Cayley Graph. To do that, pick three points A, B, C in the graph. Suppose each edge is 1 unit long. Then you can find paths (possibly consisting of several edges) joining A to B, B to C, and C to A. Some of these paths can be long winding. However some of them can be 'as small as possible. These shortest possible paths are known as geodesics. We can form a triangle ABC inside the graph by choosing geodesic paths in the graph connecting AB, BC and CA.

What Dehn found is interesting. Let G be a group and S be a generating set of the group. Let C be the Cayley graph of G. Suppose there their exists a magic number D, such that whenever you draw a triangle (having geodesic sides), any point on AC is within D unit distance from some point in AB or BC.

Here D is denoted by the Greek Letter delta

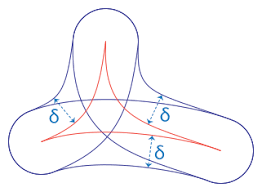
It does not matter how big the triangle is. The same magic number D must work for it.

This clearly does not happen in a piece of paper. Lets say you are guessing D = 5 (for flat piece of paper). But then you can create a large enough right triangle such that the midpoint of the hypotenuse is more than 5 units away from both the legs of the right triangle. In fact, from the stand point of geometry, a magic number D can only exists for hyperbolic spaces! This is that hyperbolicity that we discussed a while ago.

Dehn found that if such a magic number D exists for a Cayley Graph of a group , then the word problem for that group is solvable. This is a remarkable point where geometry meets algebra through hyperbolicity!

Subsequently, all spaces, where such a magic number D exists, are known as D-hyperbolic spaces. This considerably expanded the meaning of hyperbolicity and led to the rise of geometric group theory in the later part of 20th century.

Unlocking Math Olympiad Success: Navigating the Maze of Fake vs. Real Olympiads

Hey there, math enthusiasts and aspiring Olympiad champions! 🌟

Welcome back to our Math-related discussion, where we dive deep into the enchanting world of mathematics. Today, we're going to embark on a journey that's both exciting and crucial for every young math prodigy - the quest from Fake Math Olympiads to Real Math Olympiads!

The Olympiad Odyssey Begins

Picture this: Thousands and thousands of bright-eyed students in India, full of mathematical dreams, gearing up for the first level of the prestigious Indian Mathematical Olympiad (IOQM). They're armed with certificates, silver medals, and even gold medals from private Olympiads in their younger years, brimming with excitement and anticipation.

But then, reality strikes, and it's not pretty. Many of these talented youngsters are met with single-digit scores, and some even land a big, fat zero. It's disheartening, to say the least. These students, who are brimming with potential and love for mathematics, find their dreams crashing like a house of cards.

The Fake Olympiad Trap

At Cheenta, our mission is to nurture young mathematical minds, and we've seen this pattern too many times. We've got around five or six hundred students with us right now, and we've been preaching the same message over and over again: "Beware of fake Olympiads!" Why, you ask? Well, here's the scoop.

1. Question Quality: The questions in these private Olympiads often don't even come close to the real deal. They're not challenging enough and don't adequately prepare you for the IOQM.

2. False Hopes: These fake Olympiads dangle the tantalizing carrot of medals and certificates, making students believe they're math geniuses. But when the IOQM reality check arrives, it's often a rude awakening.

Real Olympiads vs. Fake Ones

Now, you might wonder, how do you tell the real Olympiads from the fakes? It's simpler than you think.

1. Organizer Matters: Genuine Olympiads are organized by reputable mathematical associations like the Mathematical Association of America or the Association of Mathematics Teachers of India (AMTI). These contests are gold mines of challenging problems crafted by true mathematical wizards.

2. Avoid Money-Making Schemes: Private Olympiads are often designed solely to make money, and they thrive on false promises. Those shiny gold medals? They're more about marketing than merit.

Nurturing Olympiad Success

So, how did our Cheenta students manage to shine in the IOQM this year? The secret is simple, but it requires dedication. We focus on problem-solving workshops, dedicating five days a week to Olympiad mathematics. It's all about non-routine mathematics and nothing else.

Your Path to Olympiad Glory

Now, here's the action plan for you, whether you're with Cheenta or charting your own course:

1. Consistency is Key: Dedicate at least one hour every day to non-routine mathematics. Consistency is the magic ingredient that fuels cumulative progress.

2. Aim for 3,000 Problems: Challenge yourself to tackle 3,000 problems in a year. For our students, that's 1,000 in class and 2,000 as homework. It's a starting point, but a strong one.

Embrace the Math Journey

Remember, mathematics is not just a subject; it's a world of wonder waiting to be explored. I'm still immersed in it, even at my age, because it's an endless adventure. Dive into the world of mathematics, seek its beauty, and you'll find yourself enchanted.

Join the Conversation!

This might be a one-sided conversation, but it doesn't have to be. Share your thoughts in the comments. What are your experiences with fake Olympiads? Let's discuss and learn together. 🌟

Watch the video by Dr. Ashani Dasgupta
Founder - faculty at Cheenta.

Sword does not need to remember how the whetstone looks

Imagine sharpening your sword with a whetstone. The job of the stone is to sharpen the sword. It does not matter what color the stone is.

Cheenta programs are designed like whetstones. They are supposed to sharpen the creativity and problem solving skills through a slow but sure process. They involve thousands of thought provoking problems, hands-on exercises and long term projects. This is perhaps one of the reasons why so many Cheenta students do well in the national and international level olympiads.

It is in fact unimportant to remember how the whetstone looks; that is it’s unnecessary for children to remember the details of the content. This is particularly true in the elementary school level olympiad programs. This content is not designed to be remembered as tools for they not. They are designed to sharpen the mind, excite the imagination and improve creative problem solving.

Take for example the module on Spatial patterns in elementary school olympiad program. One of the modules involve platonic solids such as dodecahedron, icosahedron etc. Students draw wireframe diagrams of these solids in paper, draw projection diagrams, implement it in Geogebra, draw dual solids using adjacency relations and so on. The point to note here is that platonic solids themselves are not that important. The things kids do with them is important. For example they learn about perspectivity (a visualization skill fundamental to geometry). They indirectly learn about duality, another important fundamental notion that runs through entire mathematics. As they walk through projection diagrams, their geometric visualization and spatial sense improve and get organized. These are very useful in the long run for problem solving. They also learn how to draw, redraw and think and rethink. They learn patience.

The Cheenta programs for elementary school kids are developed over the last 12 years with immense care. They incorporate findings of celebrated mathematician Cedric Villani, work of Rabindranath Thakur in Shikkhasotro, problems of Math circle experience in erstwhile Soviet Union and many other people who have worked tirelessly to improve mathematics education in elementary school. Let us know your thoughts as well.

Cross Ratio - an accidental discovery

If we know nothing about this world, we should know about cross ratio. It is one of those accidents of nature that is so unbelievable, unimaginable, that we need mathematics to accept it.

Imagine that physicist telling you: if there was no air, a feather and an iron ball would hit the ground at the same time (falling from a height).

Until and unless someone takes you to Michigan’s NASA lab, and actually creates a near-vacuum chamber and actually drops a feather and an iron ball, and they actually hit the ground at the same time, you won’t be able to accept it. Seeing is believing.

This is also true about cross ratio. Geometers may think about it as the devil’s concoction. Algebrists may think about it as their victory. But no one really knows.

Choose a point of observation O and a line L outside the point. Suppose A, B, C, D are four points in the line L. We think about OA, OB, OC and OD as lines of sight from the observer point O to the observed line L. Pappus of Alexandria, about 300 years after Christ, observed something peculiar:

(AC/AD) ÷ (BC/BD) remains invariant no matter what.

This means, if another line L’ cuts the lines of sight OA, OB, OC, OD at A’, B’, C’, D’ respectively then we will have

(AC/AD) ÷ (BC/BD) = (A’C’/A’D’) ÷ (B’C’/B’D’).

(Actually one may argue that Desargues looked into this explicitly; however Pappus certainly played with these ideas first).

This is remarkable for a variety of reasons. You do not need the concept of an angle here. No matter what the inclination of L’ is with respect to L, this ratio of ratios will be preserved. Moreover it is also tied with how our brain sees things. If A, B, C, D are equally spaced on L, it will appear to the observer that A’, B’, C’, D’ are equally spaced on L’. In a way, the invariance of this cross ratio holds the secret of how are brain works!

Indeed architects and painters during the renaissance used cross ratio and allied concept of projectivity to transform their craft. Painters used it draw realistic three dimsensional painting with lines of sight meeting at infinity.

One can compare contemporary Mughal art and Italian art to observe the difference. To illustrate this I have attached two sample pieces; one of which has lines of sight meeting at an observer point. Can you tell which one it is?

A simple addition of observer point, with lines of sight meeting at it, makes all the difference. One of them appears to be flat in our brain. The other one appears to be three dimensional.

What are opportunities after Math Olympiad?

Watch the video to learn more about opportunities after Mathematical Olympiads in India, the United States and other countries.

A beautiful book from Eastern Europe for Math Olympiads, ISI CMI Entrance and joy of doing math

Selected Problems and Theorems in Elementary Mathematics – Arithmetic and Algebra by D. O. Shklyarsky,  N. N. Chentsov and I. M. Yaglom. T

This book contains The conditions of problems, the answers and hints  to them and the solutions of the problems. The conditions of the most difficult problems are marked by stars. We recommend the reader to start with trying to solve without assistance the problem he is interested in. In case this attempt
fails he can read the hint or the answer to the problem, which may facilitate the solution, Finally, if this does not help, the solution of the problem given in the book should be studied. However, for the starred problems it may turn out to be appropriate to begin with reading the hints or the answers before proceeding to solve the problems.

(more…)

A simple convergence comparison between Leibniz's and mine pi formula

Author: Kazi Abu Rousan

Here there is $\pi$, there is circle.

Today's blog will be a bit different. This will not discuss any formula or any proof, rather it will just contain a python program to compare a $\pi$ formula given by Leibniz and a one discovered by me (blush).

How does Leibniz formula looks like?

The Leibniz formula for $\pi$ is named after Gottfried Leibniz( published in 1676). Sometimes it is also called Leibniz-Madhava series as this is actually a special case of a more general formula discovered by Madhava of Sangamagrama in 14th century.

The formula is:

$\frac{\pi}{4}$ = $1 - \frac{1}{3}$ + $\frac{1}{5}$ - $\frac{1}{7}$ + $\frac{1}{9}$ -$\cdots$ + $\frac{1}{4n+1}$ - $\frac{1}{4n+3}$ + $\cdots$

If you want a visual proof, read my article : Article- click

or this video: Geometric proof

So, how can you find $\pi$ using this?, Just calculate each fractions and add.

As an example, $4, 4(1-\frac{1}{3}) = 2.6667$, $4(1-\frac{1}{3}$ + $\frac{1}{5}) = 3.4664$, $4(1-\frac{1}{3}$ + $\frac{1}{5}$ - $\frac{1}{7}) =2.895238 $, just like this.

But it is nowhere close to the value of $\pi = 3.141592653\cdots$

The conclusion is that, it converges very slowly. Let's ask a computer to find the value of $\pi$ using the series.

pi_val = 3.1415926535897932#right value upto 17 decimals
calculated_pi_from_series = 0
n = 1000
for i in range(0,n):
    calculated_pi_from_series = calculated_pi_from_series + 1/(4*i+1) - 1/(4*i+3)
calculated_pi_from_series = 4*calculated_pi_from_series
print(calculated_pi_from_series)
print("error = ",pi_val - calculated_pi_from_series)
#output: 3.1410926536210413
#output: error =  0.0004999999687518297

For a output of $3.141592153589724$ and error $= 5.000000689037165e-07$, we need $n$ = $10,00,000$. As you can see slow this series is. But even then it has great mathematical significance. It even has a beautiful geometric relationship with Fermat's two square theorem and prime numbers.

How does my formula looks like?

As it is my own discovery, it doesn't have any name but you may call it Rousan's Formula (🤣🤣). This one is almost identical to Leibniz's formula. It is so as it also uses 2d complex numbers as it's basis just like Leibniz's formula.

The main difference is that it mine uses Eisenstein Integers, i.e., triangular grid while Leibniz's uses Gaussian Integers, i.e., regular square grid.

This formula can be written as :

$\frac{\pi}{3\sqrt{3}}$ = $1 - \frac{1}{2}$ + $\frac{1}{4}$ - $\frac{1}{5}$ + $\frac{1}{7}$ - $\cdots$ + $\frac{1}{3n+1}$ - $\frac{1}{3n+2}$ + $\cdots$

Almost same right?, now let's use python to see how fast it converges.

import math as mp
pi_val = 3.1415926535897932#right value upto 17 decimals
calculated_pi_from_series = 0
n = 1000
for i in range(0,n):
    calculated_pi_from_series = calculated_pi_from_series + 1/(3*i+1) - 1/(3*i+2)
calculated_pi_from_series = 3*calculated_pi_from_series*mp.sqrt(3)
print(calculated_pi_from_series)
print("error = ",pi_val - calculated_pi_from_series)
#output: 3.141015303363362
#output: error =  0.0005773502264312391

For $n = 10,00,000$, we get $3.1415920762392955$ with an error of $5.773504976325228e-07$. So, This shows mine converges a bit more slowly.

A direct comparison and reason

So, why mine converge more slowly?, well it is hidden in it's shape. Mine uses triangular grid and leibniz's uses squares. This is the main reason. But fear not, I have actually found a more generalized version of fermat's two square theorem, by using it i can get another similar series which converges faster than leibniz. Maybe I will discuss that in some later blog.

For now, let's try to plot both series's error. To we will plot the number of terms taken in x axis and error in y axis.

import matplotlib.pyplot as plt
import math as mp
pi_val = 3.1415926535897932
sqrt_3_3 = 3*mp.sqrt(3)

def leib_err(n):
    result = 0
    for i in range(n):
        result = result + 1/(4*i+1) - 1/(4*i+3)
    result = 4*result
    error = pi_val - result
    return result

def rou_err(n):
    result = 0
    for i in range(n):
        result = result + 1/(3*i+1) - 1/(3*i+2)
    result = result*sqrt_3_3
    error = pi_val - result
    return result
n_vals = [i for i in range(10_000+1)]
leibniz = [leib_err(i) for i in n_vals]
# print(leibniz)
rousan  =  [rou_err(i) for i in n_vals]
#
plt.plot(n_vals,leibniz,c='red',label='Leibniz Error')
plt.plot(n_vals,rousan,c='black',label='My formula Error')
plt.legend(loc='best',prop={'size':7})
plt.ylim(3.1375,3.1425)
plt.title("Error vs No. of terms for Leibniz and my $\\pi$ formula.")
plt.show()

The output is:

Error vs no. of terms for Leibniz and my pi formula
Error vs no. of terms for Leibniz and my pi formula - 2

This is all for today, see you guys next time with something new.

Your Personal Mandelbrot Set

Author: Kazi Abu Rousan

Bottomless wonders spring from simple rules, which are repeated without end.

Benoit Mandelbrot

Today, we will be discussing the idea for making a simple Mandelbrot Set using python's Matplotlib. This blog will not show you some crazy color scheme or such. But rather the most simple thing you can make from a simple code. So, Let's begin our discussion by understanding what is a Mandelbrot Set.

What is Mandelbrot Set?

In the most simple terms, The Mandelbrot set is the set of all complex numbers c for which the function $f_c(z) = z^2 + c$ doesn't goes to infinity when iterated from $z=0$.

Let's try to understand it using a example.

Suppose, we have a number $c = 1$, then to $ f_c(z)=f_1(z)= z^2 + 1 $.

Then, we first take $z_1 = f_1(z=0)=1$, after this we again calculate $z_2 = f_1(f_1(0)) = 1^2 + 1 = 2$, and so on. This goes on, i.e, we are getting new z values from the old one using $z_{n+1} = {z_n }^2 + 1$. This generates the series $0,1,2,5,26,\cdots$. As you can see, each element of this series goes to infinity, so the number $1$ is not an element of mandelbrot set.

Similarly, if we take $c=-1$, then the series is $0,-1,0.-1,0,\cdots$. This is a oscillating series and hence it will never grow towards infinity. Hence, the number $-1$ is an element of this set.

I hope this idea is now clear. It should be clear that $c$ can be any imaginary number. There is no restriction that says that $c$ must be real. So, is the number $c=i$ inside the set? Try it!!

Check if a Number is inside Mandelbrot set or not

Let's take a point $c = x+iy = P(x,y)$. So, the first point is $z_0 = 0+i\cdot 0 \to x = 0$ and $y=0$, i.e., we start the iteration from $f_c{z=0}$. Now, if at some point of iteration $|z_n|\geq 2$, then the corresponding $c$ value will not be inside the set. But if $|z|<2$, then corresponding c is inside the set.

Try this idea by hand for new numbers.

Now, let's check few numbers using a simple python code.

import numpy as np
def in_mandel(c,max_ita=1000):
    z = 0
    for i in range(max_ita):
        z = z**2 + c
        if abs(z)>=2:
            print(c," is not inside mandelbrot set upto a check of ",(i+1))
            break
        if i==max_ita-1 and abs(z)<2:
            print(c," is inside mandelbrot set upto a check of ",max_ita)
c1 = 1
in_mandel(c1)
#Output = 1  is not inside mandelbrot set
c2 = -1
in_mandel(c2)
#Output = -1  is inside mandelbrot set upto a check of  1000
c3 = 0.5+0.4j
in_mandel(c3)
#output = (0.5+0.4j)  is not inside mandelbrot set

You see how easy the code is!!, you can try out this geogebra version of you want - Check it here: Geogebra

Plot Mandelbrot set

Now, Let's plot one. We will be using a simple rule.

  1. If any number c is inside the set, we will mark that coordinate in the graph.
  2. If it is not there, we will just leave it.
import matplotlib.pyplot as plt
import numpy as np
max_ita = 1000 # number of interations
div = 1000 # divisions
c = np.linspace(-2,2,div)[:,np.newaxis] + 1j*np.linspace(-2,2,div)[np.newaxis,:]
z = 0 
for n in range(0,max_ita):
      z = z**2 + c
p = c[abs(z) < 2]#omit z which diverge 
plt.scatter(p.real, p.imag, color = "black" )
plt.xlabel("Real")
plt.grid(color='purple',linestyle='--')
plt.ylabel("i (imaginary)")
plt.xlim(-2,2)
plt.ylim(-1.5,1.5)
plt.show()

The output is:

Mandelbrot set
Mandelbrot set

This is not as good as the plots you normally see in internet like the images given below. But this one serves the purpose to show the shape of the set.

Let's try to make a bit fancier one.

The code is given here:

import matplotlib.pyplot as plt
import numpy as np
max_ita = 1000
div = 1000
c = np.linspace(-2,2,div)[:,np.newaxis] + 1j*np.linspace(-2,2,div)[np.newaxis,:] 
ones = np.ones(np.shape(c), np.int)
color = ones * max_ita + 5
z = 0
for n in range(0,max_ita):
      z = z**2 + c
      diverged = np.abs(z)>2
      color[diverged] = np.minimum(color[diverged], ones[diverged]*n)
plt.contourf(c.real, c.imag, color)
plt.xlabel("Real($c$)")
plt.ylabel("Imag($c$)")
plt.xlim(-2,2)
plt.ylim(-1.5,1.5)
plt.show()

Here is the output:

Beautiful isn't it?, This set has many mystery. Like you can find the value of $\pi$ and Fibonacci number from it. It is also hidden in Bifurcation diagram and hence related to chaos theory.

But we will live all these mysteries for some later time. This is all for today. I hope you have enjoyed this and if you have, then don't forget to share.

Collatz Conjecture and a simple program

Author: Kazi Abu Rousan

Mathematics is not yet ready for such problems.

Paul Erdos

Introduction

A problem in maths which is too tempting and seems very easy but is actually a hidden demon is this Collatz Conjecture. This problems seems so easy that it you will be tempted, but remember it is infamous for eating up your time without giving you anything. This problem is so hard that most mathematicians doesn't want to even try it, but to our surprise it is actually very easy to understand. In this article our main goal is to understand the scheme of this conjecture and how can we write a code to apply this algorithm to any number again and again.

Note: If you are curious, the featured image is actually a visual representation of this collatz conjecture \ $3n+1$ conjecture. You can find the code here.

Statement and Some Examples

The statement of this conjecture can be given like this:

Suppose, we have any random positive integer $n$, we now use two operations:

Mathematically, we can write it like this:

$f(n) = \frac{n}{2}$ if $n \equiv 0$ (mod 2)

$ f(n) = (3n+1) $ if $n \equiv 1$ (mod 2)

Now, this conjecture says that no-matter what value of n you choose, you will always get 1 at the end of this operation if you perform it again and again.

Let's take an example, suppose we take $n=12$. As $12$ is an even number, we divide it by $2$. $\frac{12}{2} = 6$, which is again even. So, we again divide it by $2$. This time we get, $\frac{6}{2} = 3$, which is odd, hence, we multiply it by 3 and add $1$, i.e., $3\times 3 + 1 = 10$, which is again even. Hence, repeating this process we get the series $5 \to 16 \to 8 \to 4 \to 2 \to 1$. Seems easy right?,

Let's take again, another number $n=19$. This one gives us $19 \to 58 \to 29 \to 88 \to 44 \to 22 \to 11 \to 34 \to 17 \to 52 \to 26 \to 13 \to 40 \to 20 \to 10 \to 5 \to 16 \to 8 \to 4 \to 2 \to 1$. Again at the end we get $1$.

This time, we get much bigger numbers. There is a nice trick to visualize the high values, the plot which we use to do this is called Hailstone Plot.

Let's take the number $n=27$. For this number, the list is $27 \to 82 \to 41 \to 124 \to 62 \to 31 \to 94 \to 47 \cdots \to 9232 \cdots$. As you can see, for this number it goes almost as high as 9232 but again it falls down to $1$. The hailstone plot for this is given below.

Hailstone for 27. The highest number and with it's iteration number is marked

So, what do you think is the conjecture holds for all number? , no one actually knows. Although, using powerful computers, we have verified this upto $2^{68}$. So, if you are looking for a counterexample, start from 300 quintillion!!

Generating the series for Collatz Conjecture for any number n using python

Let's start with coding part. We will be using numpy library.

import numpy as np
def collatz(n):
	result = np.array([n])
	while n >1:
		# print(n)
		if n%2 == 0:
			n = n/2
		else:
			n = 3*n + 1
		result = np.append(result,n)
	return result

The function above takes any number $n$ as it's argument. Then, it makes an array (think it as a box of numbers). It creates a box and then put $n$ inside it.

  1. Then for $n>1$, it check if $n$ is even or not.
  2. After this, if it is even then $n$ is divided by 2 and the previous value of n is replaced by $\frac{n}{2}$.
  3. And if $n$ is odd, the it's value is replaced by $3n+1$.
  4. For each case, we add the value of new $n$ inside our box of number. This whole process run until we have the value of $n=1$.
  5. Finally, we have the box of all number / series of all number inside the array result.

Let's see the result for $n = 12$.

n = 12
print(collatz(n))
#The output is: [12.  6.  3. 10.  5. 16.  8.  4.  2.  1.]

Similarly, for $n = 19$, the code gives us,

n = 19
print(collatz(n))
#The output is: [19. 58. 29. 88. 44. 22. 11. 34. 17. 52. 26. 13. 40. 20. 10.  5. 16.  8.  4.  2.  1.]

You can try out the code, it will give you the result for any number $n$.

Test this function.

Hailstone Plot

Now let's see how to plot Hailstone plot. Suppose, we have $n = 12$. In the image below, I have shown the series we get from $12$ using the algorithm.

Series and Step for $n=12$.

Now, as shown in the above image, we can assign natural numbers on each one of them as shown. So, Now we have two arraies (boxes), one with the series of numbers generated from $n$ and other one from the step number of the applied algorithm, i.e., series of natural numbers. Now, we can take elements from each series one by one and can generate pairs, i.e., two dimensional coordinates.

As shown in the above image, we can generate the coordinates using the steps as x coordinate and series a y coordinate. Now, if we plot the points, then that will give me Hailstone plot. For $n = 12$, we will get something like the image given below. Here I have simply added each dots with a red line.

The code to generate it is quite easy. We will be using matplotlib. We will just simply plot it and will mark the highest value along with it's corresponding step.

import numpy as np
import matplotlib.pyplot as plt
def collatz(n):
    result = np.array([n])
	while n >1:
		# print(n)
		if n%2 == 0:
			n = n/2
		else:
			n = 3*n + 1
		result = np.append(result,n)
	return result
n = 63728127
y_vals = collatz(n); x_vals = np.arange(1,len(y_vals)+1)
plt.plot(x_vals,y_vals)
x_val_max = np.where(y_vals == max(y_vals))[0][0]+1
plt.text(x_val_max, max(y_vals), '({}, {})'.format(x_val_max, int(max(y_vals))))
plt.grid(color='purple',linestyle='--')
plt.ylabel("Sequence Generated")
plt.xlabel("Number of Iteration")
plt.show()

The output image is given below.

Crazy right?, you can try it out. It's almost feels like some sort of physics thing right!, for some it seems like stock market.

This is all for today. In it's part-2, we will go into much more detail. I hope you have learn something new.

Maybe in the part-2, we will see how to create pattern similar to this using collatz conjecture.

Walking with the Masters

Over the years, I have encountered thousands of children who had the potential to learn beautiful mathematics. But many of them never did. I think about these incidents as missed opportunities. After all, mathematics has led me to great joy in life. I wish this joy for more people.

One possible reason which prevented their growth is the lack of great teachers. This is not an accident but a statistical inevitability. The number of passionate teachers per capita is low in India and will remain low in the foreseeable future. Therefore the probability that a kid with great potential encounters an equally passionate teacher is also low.

This problem in pedagogy may be partially addressed using Abel's strategy. Norwegian mathematician Niels Henrik Abel was one of the most promising mathematicians of all time. Unfortunately, he died at the early age of 26. Among other things, when he was 16, he discovered proof of the binomial theorem that works for all numbers. At the age of 19, he showed that a quintic equation cannot be solved algebraically. When he was asked how he learned so much mathematics so fast, he responded, "by studying the masters, not their pupils."

Abel was referring to the books written by true masters of mathematics. Personally speaking, over the years I have become more and more convinced about Abel's strategy. Reading regular textbook-styled works is not only a waste of time, but it may also have a negative impact on an enthusiastic learner. On the other hand, reading a book written by a true master is like learning from him or her directly. It is an outstanding opportunity that none of us should miss.

Here are some of those walks with the masters, that have transformed my life and the way I do mathematics. You may use this list of beautiful mathematics books to stay inspired.

Class 1 to 5

Class 6 to 8

Class 9 and above (in school)

Higher Mathematics

Please be careful about using this list. It is not supposed to be a collection of exhaustive learning material for all possible topics. Use these books for inspiration. Moreover, I plan to update this list periodically. You may bookmark it for later use.

All the best.

Dr. Ashani Dasgupta

Cheenta

Read more ...