CMI Data Science Entrance Books [Pdf] and Free Resources
Indian Institute of Technology is one of the top statistics departments in the country with great research and placement opportunities. It conducts an entrance exam for the aspirants who want to pursue a master's in Statistics called the IIT JAM MS Entrance Exam. To crack this exam, the best source of study materials is the right books. So, I am here to provide you the list of useful books for IIT JAM MS Entrance Exam preparation based on Syllabus.
A short note on the IIT JAM MS Entrance Exam: The MS programme offers advance level training in the theory, methods and applications of Statistics along with specialized training in selected areas of Statistics and allied fields. Depending on the area of specialization, students would be able to pursue an academic/research career in Statistics, Mathematics, Economics, Computer Science, and allied fields.
IIT JAM MS Entrance Exams Books according to the syllabus:
As mentioned in the website Entrance Exam mainly consists of 2 topics:
Mathematics (40%)
Probability and Statistics (60%)
Let's start with the Mathematics books required for IIT JAM MS Entrance Exam Preparation:
High School Mathematics - The mathematics part is super easy. So just be fluent in your 10+2 syllabus of mathematics and have a piece of sound knowledge in Calculus and Linear Algebra. Also, solve past year problems.
Although High School Mathematics part come less in the examination.
Let's discuss the books for Probability and Statistics Part, breaking it into different subsections according to the syllabus:
5. A book named "Solutions to IIT JAM for Mathematical Statistics" by Amit Mishra and Mohd. Arshad covers previous year solutions till 2018. You can consider buying that book for your IIT JAM MS Preparation.
Other Useful Resources
IIT JAM Statistics Crash Course for 2022
Early bird Registration is Going On. Classes start from 1st week of October, 2021.
Monte Carlo Method to calculate Pi
Author: Kazi Abu Rousan
Pi is not merely the ubiquitous factor in high school geometry problems; it is stitched across the whole tapestry of mathematics, not just geometry’s little corner of it.
$\pi$ is truly one of the most fascinating things exist in mathematics. It's not just there in geometry, but it's also there in pendulum, waves, quantum particles, integrations, probability and even in biology.
Today we will be seeing one of the places where it arises in probability.
The name "Monte Carlo" refers to the city in Monaco which is known for it's casinos and gambling. So, Monte Carlo is basically used as a symbol of randomness.
Monte Carlo's Method or Monte Carlo experiments, are a broad class of computational algorithms that rely on repeated random sampling to obtain numerical results. The underlying concept is to use randomness to solve problems that might be deterministic in principle.
We will be using one of those experiment to find value $\pi$.
Probability and $\pi $
Let's start from the basics.
Suppose, we have a line from $0$ to $5$ unit and we throw a dot at random. The question is: What is the probability that the dot will be on the line between $2$ to $3$ unit?
The answer is : $\frac{1}{5}$
Why?, because the probability is simply $\frac{length\ of\ favorable\ region}{length\ of\ whole\ region}$.
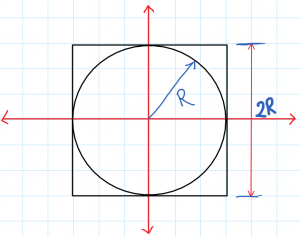
Now, suppose we have a circle inside a square as shown in the figure.
The circular and Square region
We now throw a ball at random inside the square. What is the probability that the ball will land inside the circle?, The answer is simply the ratio of the areas of the favorable region and the total region (here we are using the area as it is a two-dimensional region).
So, $$P = \frac{\pi R^2}{4\times R^2} = \frac{\pi}{4}\to \pi = 4\times P $$
Now, the question is how to find the value of $P$?
Well, we can just use the Experimental definition of probability. This definition simply says "The probability is equals to the ratio of number of events whose results are favorable and the total number of experiments done.
In our case, It simply means $P = \frac{No. \ of\ balls\ which\ are\ fallen\ inside\ circle}{Total\ No.\ of\ balls\ thrown}$
This exact idea can be used to write a program to find the value of $\pi $.
Python Code to find $\pi $
Let's begin our coding.
We will be taking a unit circle. Python's numpy library has many functions to generate randomnumber, we will be using that.
This block of code generates two arraies (list) containing values between $-1 to 1$. We will use each of those values from x_vals as x-coordinate of each ball and y_vals as y-coordinates of each ball. There $n$ represent number of balls.
Now, we need a function which will check if a ball is inside the circle or not. This is quite easy. We can just find $x^2+y^2$, if it's less than or equals to $1$, then it's inside the circle or else, it's outside.
Now, we will combine all this to write a code and calculate the value of $\pi $.
import numpy as np
import matplotlib.pyplot as plt

n = 100000#also used 4, 10,100etc
x_vals = np.random.uniform(-1,1,n)
y_vals = np.random.uniform(-1,1,n)
coords = np.vstack((x_vals,y_vals)).T

def check_in_circle(coord):
	if coord[0]**2+coord[1]**2<=1:
		return True
	else:
		return False
inside_count = 0
for i in range(n):
	if check_in_circle(coords[i]):
		inside_count += 1
print("Value of pi = ",4*(inside_count/n)," for n = ",n)
#Output: Value of pi =  3.13572  for n =  100000
Value of pi =  3.0  for n =  4
Value of pi =  3.08  for n =  100
Value of pi =  3.1324  for n =  10000
As you can see, the value to $\pi $ from this method approaches it's real value as we increase $n$. Let's see a plot for few values of $n$ (along with code)
The code to generate this is here:
import numpy as np
import matplotlib.pyplot as plt

n = 100000
x_vals = np.random.uniform(-1,1,n)
y_vals = np.random.uniform(-1,1,n)
coords = np.vstack((x_vals,y_vals)).T
inside_x = []; inside_y = []
def check_in_circle(coord):
	if coord[0]**2+coord[1]**2<=1:
		return True
	else:
		return False
for i in range(n):
	if check_in_circle(coords[i]):
		inside_x.append(coords[i][0])
		inside_y.append(coords[i][1])
inside_count = len(inside_x)
pi_val = 4*inside_count/n
figure, axes = plt.subplots()
plt.scatter(x_vals,y_vals,color="BLUE",s=0.1)
plt.scatter(inside_x,inside_y,color="GREEN",s=0.1)
qa = plt.Circle((0,0),1,fill=False, color="RED", linewidth=2)
plt.xlim(-1.01,1.01)
plt.ylim(-1.01,1.01)
axes.set_aspect(1)
axes.add_artist(qa)
plt.title("n=%s and points_inside = %s, $\\pi$ = %s"%(n,inside_count,pi_val))
plt.show()
We can make a video of $\pi $ vs $n$ to see how it converges.
This is all for today. The code for the video can be found here: Code of Animation
I hope you learn something new.
ISI MStat Entrance 2021 Problems and Solutions PSA & PSB
This post contains ISI MStat Entrance PSA and PSB 2021 Problems and Solutions that can be very helpful and resourceful for your ISI MStat Preparation.
12. $P(\pi)$ is even for all $\pi$. (Observe that there is one more odd than number of evens, so there will be one odd-odd match)
13. is equal to 12. (The $i,j$th element is $a_{ii}b{ij}c{jj}$. Use gp series then.)
14. 160 (Use the fact any permutation can be written as compositions of transpositions. Observe that the given condition is equivalent to that 2 transpositions are not possible)
15. $m_t < \infty$ for all $t \geq 0$ (All monotone functions are bounded on [a,b])
16.$H(x) = \frac{1-F(-x)+ F(x)}{2}$ (If $F(x)$ is right continuous, $F(-x)$ is left continuous.).
17. $\frac{1}{25}$ (Use the distribution function of $\frac{X}{Y}$)
18. 3 (Find the distribution of order statistic, and find the expectation)
19. (II) but not (I) (If $F(x)$ is right continuous, $F(-x)$ is left continuous.).
20. $20\lambda^4$ (Use gamma integral to find the $E(X_{1}^4)$.)
21. The two new observations are 15 and 5. (Use the condition to find two linear equations to find the observations).
22. It is less than 2. (Use the beta coefficients in terms of sample covariance and sample variance, and compare)
23. 4:3 (Use Bayes' Theorem)
24. The two-sample t-test statistic and the ANOVA statistics yield the same power for any non-zero value of $\mu_1 - \mu_2$ and for any $n,m$. (Both the test statistic are one to one function of one another)
25. t³-1 - 2(t-1)
26. $\frac{2 \sum_{i=1}^{n} X_i}{n(n+1)}$ (Use the invariance property of MLE)
27. $Y_1^2 + Y_2^2 + Y_1Y_2$ (Write the bivariate normal distribution in terms of $Y_1, Y_2$ and use Neyman Factorization Theorem.)
28. can be negative (Simson's Paradox)
29. $2z$ (There are three random variables, $N$ = stopping time to get $Y=1$, $Y$ and $X$. Use the conditioning properly. Take your time)
30. $\frac{40}{3}$ (Use the property that Poisson | Poisson in the given problem follows Binomial)
ISI MStat 2021 PSB Solutions
Coming soon.
ISI MStat PSB 2021 Problem 1
Solution
ISI MStat PSB 2021 Problem 2
Solution
ISI MStat PSB 2021 Problem 3
Solution
ISI MStat PSB 2021 Problem 4
Solution
ISI MStat PSB 2021 Problem 5
Solution
ISI MStat PSB 2021 Problem 6
Solution
ISI MStat PSB 2021 Problem 7
Solution
ISI MStat PSB 2021 Problem 8
Solution
ISI MStat PSB 2021 Problem 9
Solution
Please suggest changes in the comment section.
Cheenta Statistics Department ISI MStat and IIT JAM Training Program
3 Lessons to Learn from the Father of Mathematics in India: Aryabhata
Aryabhata is considered the "Father of Mathematics" in India. He is the first ancient Mathematician- Astronomer, whose important work includes "Aryabhatiya" and "Arya-Siddhanta". Today, let's learn 3 lessons from Aryabhata - the 𝗙𝗮𝘁𝗵𝗲𝗿 𝗼𝗳 𝗠𝗮𝘁𝗵𝗲m𝗮𝘁𝗶𝗰𝘀.
𝟭. 𝗛𝗮𝘃𝗲 𝗖𝗼𝘂𝗿𝗮𝗴𝗲 𝘁𝗼 𝗤𝘂𝗲𝘀𝘁𝗶𝗼𝗻
When eclipses were seen as something to be feared, and the concepts of "Rahu" and "Ketu" ruled the mind of the people, Aryabhata was not afraid to make astonishing claims and revolutionized Indian Astronomy.
He dispenses with Rahu and Ketu, explains eclipses as due to shadows of the earth and the Moon, and describes how to calculate their timing and their size. He was not afraid of refuting traditional wisdom if it did not agree with reality.
𝟮. 𝗙𝗶𝗻𝗱 𝗮 𝘄𝗮𝘆 𝘁𝗼 𝗜𝗻𝗻𝗼𝘃𝗮𝘁𝗲
The Aryabhatiya (Aryabhata's book) presented a number of innovations in mathematics and astronomy in verse form, which were influential for many centuries.
Also, he did not use the Brahmi numerals. Continuing the Sanskritic tradition from Vedic times, he used letters of the alphabet to denote numbers, expressing quantities, such as the table of sines in a mnemonic form.
Aryabhata from the age of 23, skillfully researched various fields and recorded his findings in his book, Aryabhatiya.
He is credited to have set up an observatory at the Sun temple in Taregana, Bihar.
He also came up with an approximation of pi and determined that pi (π) is irrational.
He was the first mathematician to give what later came to be known as the tables of sine, cosine, versine, and converse sine to four decimal spots, which brought forth trigonometry.
On this Father's day, this was our way to pay a tribute to the Father of Mathematics in India.
Is Multivariate Limit = Iterated Limit? Multivariate Limit Demystified
Is Multivariate Limit equal to Iterated Limit?
The multivariate limit is really akin to the univariate limit. But, how can we explain that?
However, We discuss the following aspects in this regard.
📌 Firstly, we discuss the ideas of proving and disprove Univariate Limits. 📌 Then, come Multivariate Limits - How to prove and disprove? 📌 Thereafter, Iterated Limits appear - Understanding and Geometry. 📌 Hence, we discover Relationship between Multivariate Limits and Iterated Limits. 📌 We end with Food for Thought.
Iterated Limits are a bypass. Do they really explain the Multivariate Limit?
We discover a rich relationship between the two. We give all the cases possible between multivariate limits and iterated limits.
Hints, Solution, and More
Write down the \( \epsilon - \delta\) definition of multivariate limit.
How can you disprove the existence of a multivariate limit?
Think of some useful ways to prove the existence of a multivariate limit?
Maximum Likelihood Estimation is an algorithm to find a reasonable estimator. Personally, it really woos my mind - simple and yet so beautiful. Method of Moments is simpler. It doesn't woo me :p. However, still, they have a lot of similarities. Thus, we have set off to explore them. Finally, we ask for a lot of food for thought. After all, we are all explorers at heart.
We ask "Is MLE = MOM? If not, when?"
We discover a rich relationship between the two. We discover the score function and so much more exciting.
Hints, Solution, and More
Find out examples where the estimates of Maximum Likelihood and Method of Moments are same.
Find out examples where the estimates of Maximum Likelihood and Method of Moments are not same.
Prove that Maximum Likelihood Estimation is same as solving \(\sum_{i=1}^{n} \frac{\partial}{\partial \theta} \log f\left(X_{i} \mid \theta\right)=0\).
Prove that Method of Moments Estimation is same as solving \((\frac{1}{n} \sum_{i=1}^{n} X_{i}^{k}-\mu_{k}(\theta)=0)\).
Let's explore the connection in the video.
Don't forget the food for thought.
Enjoy the video
Build your foundations.
Ace your Exams.
Learn. Enjoy. Practice. Repeat.
Above all, prove that \(E(h(X, \theta))=0\) for Maximum Likelihood Estimation and Method of Moments Estimation.
In addition, what is the intuition of the score function? Thus, we ask what is the intuition of the variance of the score function?
Do you think that method of moments and maximum likelihood estimate is equal for the exponential family?
As a result, we explore a one-parameter family. Thus, can you find out the pdf of the distributions for which the two estimates will be the same?
However, can you comment on the sufficient statistic, if the estimates are the same?
ISI MStat 2020 PSB Problem 9 | Discussion & Solution
ISI MStat 2020 PSB Problem 9
This post discuses the problem 9 of the ISI MStat 2020 PSB Entrance Exam.
A finite population has \(N\) units, with \(x_{i}\) being the value associated with the \(i^{\text {th }}\) unit, \(i=1,2, \ldots, N\). Let \(\bar{x}{N}\) be the population mean.
A statistician carries out the following experiment.
Step 1: Draw a SRSWOR of size \(n({1}\) and denote the sample mean by \(\bar{X}{n}\).
Step 2: Draw a SRSWR of size \(m\) from \(S{1}\). The \(x\) -values of the sampled units are denoted by {\(Y_{1}, \cdots, Y_{m} \)}.
Hints, Solution, and More
\(\tilde{X}\) follows SRSWOR on population with mean \(\mu\).
\(E_{\tilde{X}}\left(\bar{X}{n}\right)=\mu\)
\(\tilde{Y} \mid \tilde{X}\) follows SRSWR on \(\tilde{X}\) with mean \(\bar{X}{n}\)
This post discuses the problem 6 of the ISI MStat 2020 PSB Entrance Exam.
Suppose individuals are classified into three categories C1,C2 and C3.
Let p2,(1−p)2 and 2p(1−p) be the respective population proportions, where p∈(0,1). A random sample of N individuals is selected from the population and the category of each selected individual recorded.
For i=1,2,3, let Xi denote the number of individuals in the sample belonging to category Ci. Define U=X1+X32.
Is \(U\) sufficient for \(p\) ? Justify your answer.
Show that the mean squared error of \(\frac{U}{N}\) is \(\frac{p(1-p)}{2 N}\).
Hints, Solution, and More
Prove that the joint distribution of \((X_1,X_2,X_3)\) follows Multinomial Distribution.
Write the Likelihood of the data.
Use Neymann Factorization to prove the sufficiency of \(U\).
Show that \(\frac{U}{N}\) is unbiased.
Show that \(2U\) follows Binomial Distribution.
Do subscribe to our channel to get instant notification of Live Session, so that you can join us live in the master classes!
Build your foundations.
Ace your Exams.
Learn. Enjoy. Practice. Repeat.
Prove that \(\frac{U}{N}\) is the UMVUE of \(p\).
Find the minimal sufficient and complete statistic of \(p\).
For other Food for Thought, refer to the youtube video for full solution.
IIT JAM Statistics Entrance Exam books based on Syllabus
Indian Institute of Technology is one of the top statistics departments in the country with great research and placement opportunities. It conducts an entrance exam for the aspirants who want to pursue a master's in Statistics called the IIT JAM MS Entrance Exam. To crack this exam, the best source of study materials is the right books. So, I am here to provide you the list of useful books for IIT JAM MS Entrance Exam preparation based on Syllabus.
A short note on the IIT JAM MS Entrance Exam: The MS programme offers advance level training in the theory, methods and applications of Statistics along with specialized training in selected areas of Statistics and allied fields. Depending on the area of specialization, students would be able to pursue an academic/research career in Statistics, Mathematics, Economics, Computer Science, and allied fields.
IIT JAM MS Entrance Exams Books according to the syllabus:
As mentioned in the website Entrance Exam mainly consists of 2 topics:
Mathematics (40%)
Probability and Statistics (60%)
Let's start with the Mathematics books required for IIT JAM MS Entrance Exam Preparation:
High School Mathematics - The mathematics part is super easy. So just be fluent in your 10+2 syllabus of mathematics and have a piece of sound knowledge in Calculus and Linear Algebra. Also, solve past year problems.
Although High School Mathematics part come less in the examination.
Let's discuss the books for Probability and Statistics Part, breaking it into different subsections according to the syllabus:
5. A book named "Solutions to IIT JAM for Mathematical Statistics" by Amit Mishra and Mohd. Arshad covers previous year solutions till 2018. You can consider buying that book for your IIT JAM MS Preparation.
Other Useful Resources
IIT JAM Statistics Crash Course for 2022
Early bird Registration is Going On. Classes start from 1st week of October, 2021.