NOAI 2024 China
Basket Ball Shooting
I. Question Overview
A CSV file of basketball stars' shooting data is given, which is stored in the training set data_train.csv. The meaningful variables are named as follows:
loc_x: The horizontal position of the basketball star on the court when shooting, which has been normalized. There is no need to consider the unit.loc_y: The vertical position of the basketball star on the court when shooting, which has been normalized. There is no need to consider the unit.minutes_remaining: The number of minutes remaining in the current quarter, which has been normalized. There is no need to consider the unit.shot_distance: The distance from the shooting position to the basket, which has been normalized. There is no need to consider the unit.shot_made_flag: Whether the shot is made or not. If it is made, the value is 1; otherwise, the value is 0.shot_id: The unique identifier of the sample.
Now, it is hoped that you can build a model based on the historical data of the basketball star to predict the shooting result of the star. There are 20,000 data points in the training set, and the test set has approximately 5,000 data points. The format is similar to that of the training set, and the contestants cannot access it during the competition.
II. Data Set
Address of the training set: Training Set.
III. Task
Please use PyTorch to implement a multi-layer perceptron (neural network) model to predict whether a contestant can make a shot at different positions. The specific requirements are as follows:
- The input consists of 2 features (
loc_x,loc_y), and the output is 1 label (shot_made_flag). 1 indicates that the shot is made, and 0 indicates that the shot is missed. - Only linear layers and activation functions after linear layers can be used, and at most 3 linear layers can be used. Please build the neural network directly and do not use
nn.Sequential()nesting. The scoring system cannot detect the network structure insidenn.Sequential(), and a score of 0 will be directly given. - The activation function can only be selected from
nn.Linear,nn.ReLU,nn.Sigmoid,nn.Tanh,nn.ELU,nn.LeakyReLU,nn.PreLU. Each linear layer can have at most 8 neurons. - The loss function, optimizer (solver), and learning rate can be freely selected.
IV. Submission
Please submit a compressed file named submission.zip. After decompression, it should contain the model file submission_model.py and the model parameter file submission_dic.pth. The specific requirements are as follows:
- Save the class definition of the model and the required precursor libraries in
submission_model.py. - Save the trained model parameters in
submission_dic.pth. The model parameters will be loaded during scoring. - You can refer to the method in
baseline.ipynbto generate thesubmission.zipfile on the platform for submission. You can also download the data set to the local machine, train the model, and then package it into asubmission.zipfile for submission.
Address of
baseline.ipynb: Question 1 of APOAI2025 Mock Competition_baseline.
V. Scoring
- When the number of linear layers and the number of neurons in the neural network meet the requirements, the score is the accuracy rate of the test set.
- When the number of linear layers and the number of neurons in the neural network do not meet the requirements, the score is 0.
Remarks: The leaderboard A uses 50% of the data in the test set, which can be displayed in real time during the competition to help contestants debug the model. The leaderboard B uses the remaining 50% of the data in the test set and is calculated after the competition ends. The score of the leaderboard B is the final score.
NOAI 2024 China - News Text Classification Task
I. Question Overview
A dataset for news text classification is provided, which is stored in a .csv file and contains two variables:
text: The content of the news text.category: The category of the news text.
The training set is stored in train_news.csv, with a total of 1,000 samples. The testing set is stored in test_news.csv, with a total of 200 samples. During the competition, the test set samples without labels will be provided.
II. Data Set
- Address of the training set:
train_news.csv, Training Set; - Test set (without labels):
test_news_nolabel.csv, which contestants cannot access or download; - Test set (with labels):
test_news_label.csv, which contestants cannot access or download.
III. Task
Please use PyTorch to design and train a natural language processing model to achieve the news text classification task, that is, input the sentences of the news and output the news categories.
The specific requirements are as follows:
- The total training time and testing time using the CPU should not exceed 10 minutes. The connection time and queuing time are not counted into the total time.
- Tip: It is recommended to use Word Embedding + LSTM.
IV. Submission
Please submit the submission.ipynb file, which contains the entire process of training the model. In submission.ipynb, store the prediction results of the test set in submission.csv. The naming and storage method of the label should be consistent with that of train_news.csv.
You can refer to the submission format in baseline.ipynb. The address of baseline.ipynb: Question 3 of APOAI Mock Competition_baseline.
V. Scoring
- When the training and testing are completed within the specified time, the scoring criterion is the average value of the F1-Scores of all categories. Please look up the meaning of F1-Score on the Internet by yourself.
- If the F1-Scores of all categories are not calculated, a score of 0 will be given.
- If the total time for training and testing exceeds the time limit, a score of 0 will be given.
NOAI 2024 China - Pendulum Motion with Missing Data
I. Question Overview
A dataset for pendulum motion is provided, which is stored in a .csv file and contains two variables:
t: Time, unit: second (s), it is in the standard unit, and there is no need to consider unit conversion during the problem-solving process;theta: The angle of the pendulum, with positive and negative values indicating the direction, and the unit is radian; that is, there is no need to consider unit conversion when using the sin function for operations.
Based on the above dataset, please use PyTorch to regress the relevant parameters of the pendulum motion with resistance, fill in the missing data and make predictions.
II. Data Set
There are three datasets.
- Training set:
pendulum_train.csv, Address of the training set: Training Set; - Test set A:
pendulum_testA.csv. Contestants cannot directly download Test set A during the competition; - Test set B:
pendulum_testB.csv. Contestants cannot directly download Test set B during the competition.
The data in the training set is all visible, which can help contestants generate methods for solving parameters. The data of Test set A is invisible to contestants, but it will be displayed in the Leaderboard A, which can help contestants verify whether the method for solving parameters is correct. The data of Test set B is invisible to contestants and will finally be used when calculating scores in the Leaderboard B.
Note: The differential equation parameters of the training set, Test set A and Test set B are all different. What contestants need to submit is a solution method that can be applied to different data. When importing different data sets, that is, when importing the training set, Test set A and Test set B, the correct parameters can be solved.
III. Task
In machine learning, we sometimes encounter scenarios where we need to extract the patterns in data with a small amount of data. In such scenarios, how to make full use of prior knowledge (formulas) to process data, design models and successfully solve unknown parameters is the key to solving the problem. Now consider a pendulum scenario.
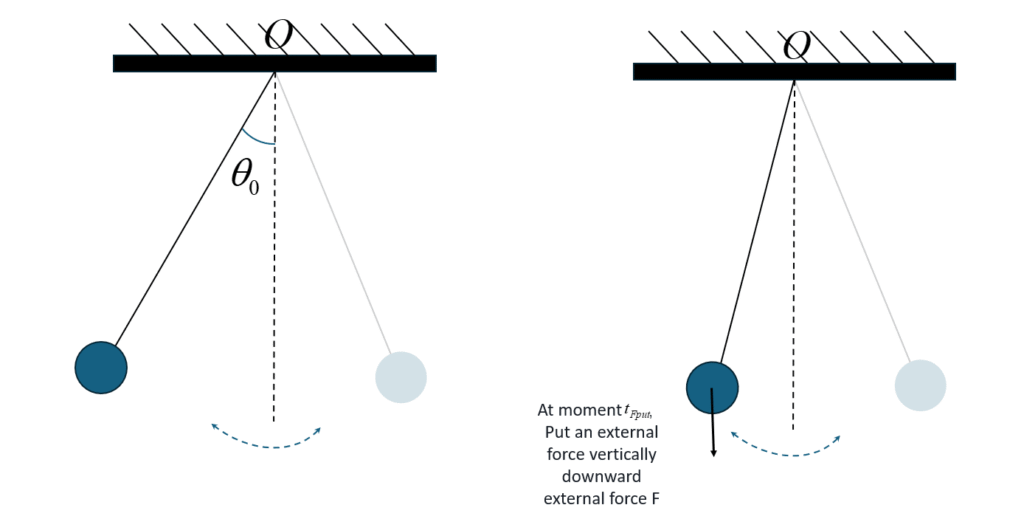
As shown in the above figure, there is a small ball with a mass of 1$(m=1)$that can be regarded as a particle, which is suspended by a light rope with a length of $l$ at a fixed point $O$. Let $\theta(t)$ be the angle between the rope and the vertical line passing through $O$ at time $t$, which is called the pendulum angle.
Stretch the rope straight and release the small ball with an initial pendulum angle $\theta_0<\pi / 2$ (in radian measure). If you don't understand radian measure, you can ask a large language model). At $t=0$, release the small ball without an initial velocity, and then the small ball can move in the plane corresponding to the light rope and the vertical line. Here, taking the initial pendulum angle $\theta_0$ as positive, when the small ball is on the left side of the vertical line, the sign of the pendulum angle$\theta(t)$ is recorded as positive, and when it is on the right side of the vertical line, the sign of the pendulum angle $\theta(t)$ ) is recorded as negative.
Let the acceleration due to gravity be $g=9.8$ (during the whole problem-solving process, there is no need to consider unit conversion, and you can directly operate on the numerical values).
Consider the air resistance whose magnitude is proportional to the velocity and whose direction is opposite to the velocity, and the magnitude of the air resistance $\mu$ remains constant during the motion.
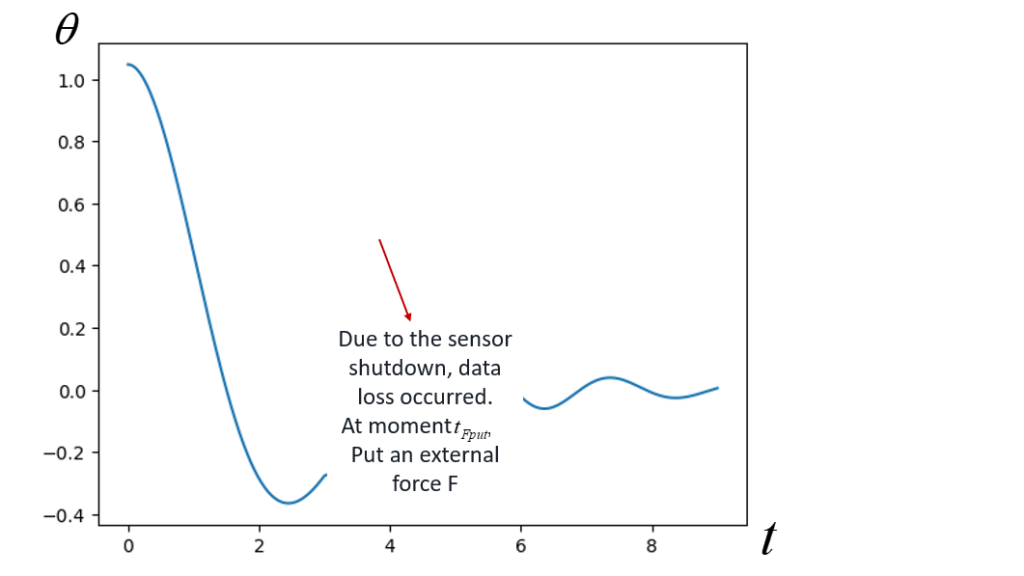
There is a sensor that can accurately record the pendulum angle of the small ball. However, during the experiment, the sensor had a problem. It suddenly interrupted for several seconds ( $\geq 1 s$ ) during the recording and was restarted only after that, and it stopped working before the small ball stopped moving. It is known that starting from a certain moment $t_{F_{\text {put }}}$ during the interrupted period, the small ball was subjected to a constant external force $F$ in the vertical downward direction, and this continued until the end of the motion.
There is a sensor that can accurately record the pendulum angle of the small ball. However, during the experiment, the sensor had a problem. It suddenly interrupted for several seconds ( $\geq 1 s$ ) during the recording and was restarted only after that, and it stopped working before the small ball stopped moving. It is known that starting from a certain moment $t_{F_{\text {put }}}$ during the interrupted period, the small ball was subjected to a constant external force $F$ in the vertical downward direction, and this continued until the end of the motion.
Please try to infer and predict the situation of the small ball based on the recorded data. The data is in the .csv file, which includes two columns. The first column records the time stamp $t$ of the small ball's motion, represented by the variable t , and the second column records the pendulum angle information $\theta$ of the small ball, represented by the variable theta. We plot the pendulum angle data $\theta(t)$ in the training set as follows:
To solve this problem, you need to have prior knowledge of differential equations. During the whole motion process, the angular velocity $\omega(t)$ refers to the instantaneous change rate of $\theta(t)$ (with positive and negative values), and the angular acceleration $a(t)$ refers to the instantaneous change rate of the angular velocity $\omega(t)$ (with positive and negative values), that is, $\omega(t)=\frac{d \theta(t)}{d t}, a(t)=\frac{d \omega(t)}{d t}$ (if you don't understand derivatives, you can ask a large language model). Then, in the above pendulum problem, $a(t)$ should satisfy the following differential equation with $\omega(t)$ and $\theta(t)$ :
$$
a(t)=-\alpha \cdot \omega(t)-\beta \sin (\theta(t)),
$$
where $\alpha$ and $\beta$ are parameters. According to Newton's second law,
- $\alpha=\frac{\mu}{m}$.
When $t \geq t_{F_{\text {put }}}$ an external force $F$ is applied. At this time, $\beta=\beta_2=\frac{g}{l}+\frac{F}{m l}$.
Using the differential equation, if $\alpha_{,} \beta_1$, and $\beta_2$ are known, when the angular velocity $\omega(t)$ and the pendulum angle $\theta(t)$ at time $t$ are known, $a(t)$ can be calculated according to the differential equation.
However, the problem in this question is that $\alpha, \beta_1$, and $\beta_2$ are unknown, and only the pendulum angle data $\theta(t)$ recorded at each moment is available. You need to "regress" $\alpha, \beta_1$, and $\beta_2$ according to the provided data. This is the core task in this question.
After obtaining $\alpha, \beta_1$, and $\beta_2$, it is equivalent to obtaining the entire differential equation, and then you can use the differential equation to complete and predict the pendulum angle data of the small ball.
Specifically, you need to solve the following parameters according to the time $t$ and $\theta(t)$ data recorded in the .csv file:
- The length of the rope: $l$;
- The air resistance: $\boldsymbol{\mu}$;
- The magnitude of the external force applied in the middle: $\boldsymbol{F}$;
- Predict the moment when the pendulum angle $\theta(t)=0$ after the sensor detection ends (after the data recording ends) and after the external force is applied: $t_{\text {nextzerotheta: }}$
- The time when the external force is applied: $t_{F_{\text {puts }}}$
